TxDOT: Statewide Traffic Delays Fell 11% Even as Travel Grew 13%
TxDOT said Nov. 19 that statewide traffic delays in 2025 were 11 percent below 2017, even as travel grew 13 percent, saving commuters an estimated $1.6 billion. All of the current Top 100 congested segments are in the four largest metro areas.
Statewide traffic delays in Texas were down 11 percent in 2025 from a recent peak in 2017, even as travel grew 13 percent, the Texas Department of Transportation said in a Nov. 19 release on its 2026 Texas Top 100 Congested Road Segments Report.
TxDOT said those changes saved commuters an estimated $1.6 billion in delay and fuel costs in 2025 compared with 2017, or about $235 per commuter each year. The 11 percent and 13 percent figures are statewide comparisons. The Top 100 list itself, the agency said, is made up entirely of road segments in the state’s four largest metro areas: Dallas/Fort Worth, Houston, San Antonio and Austin.
“We’re targeting construction where it can make the biggest difference, focusing directly on some of the state’s most congested roads,” TxDOT Executive Director Marc Williams said. “Even as more people travel on Texas roads, delays are down statewide. That’s real progress — and it shows our investments are working to save Texans time and money.”
The department said it is meeting rising travel demand “with a record number of projects,” and that nearly half of the roads identified in the report are already under construction. In a separate figure covering 2025, it said 41 of the Top 100 congested segments were under construction that year, including several Texas Clear Lanes projects. The release does not treat those two statements as the same count, and they are reported here as they were given.
Projects That Moved the Rankings
In the Rio Grande Valley, TxDOT said the I-2/I-69C interchange project cut annual traffic delay on two segments of I-2 by 96 percent, improving the ranking of one segment from 95 to 1,653 and another from 103 to 1,669.
Other examples the department highlighted:
In Houston, the I-610 at SH 288 Texas Clear Lanes project has cut annual traffic delay by 65 percent, improving the ranking from 25 to 96.
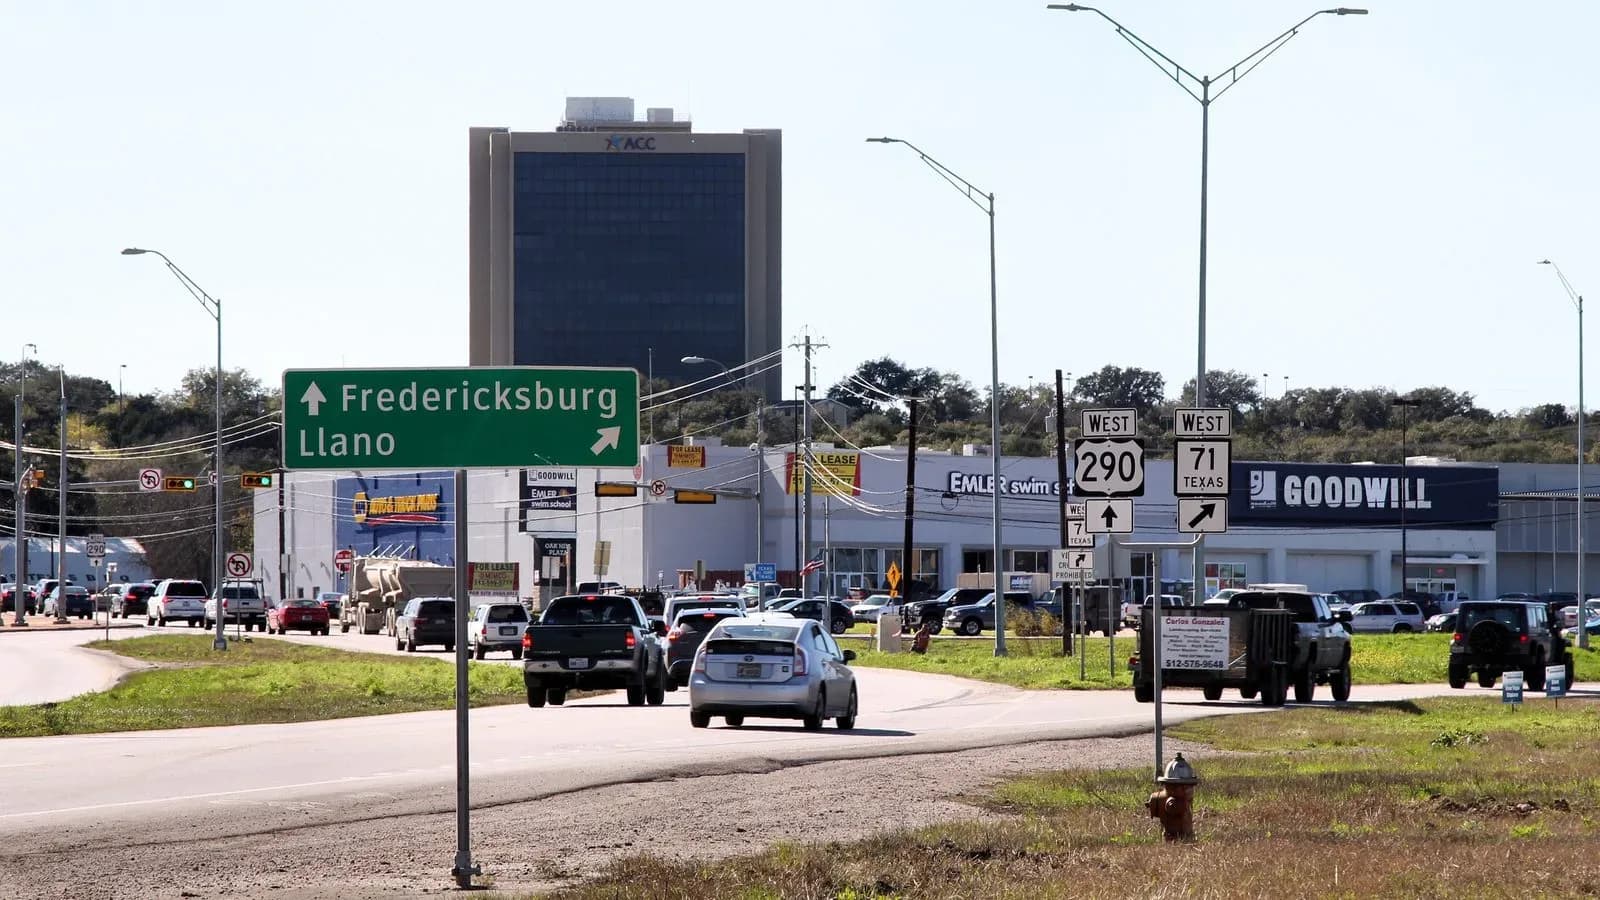
In Austin, partial completion of the US 290/SH 71 at Oak Hill Texas Clear Lanes project has cut annual traffic delay by 40 percent, improving the ranking from 45 to 79.
In Fort Worth, the I-820 Texas Clear Lanes project has cut annual traffic delay by 15 percent, improving the ranking from 28 to 43.
Texas Clear Lanes, the release said, targets congestion in the state’s largest metro areas. TxDOT also said projects in smaller cities are delivering relief as work is completed.
“Texas is proving that growth doesn’t have to mean gridlock,” said Texas Transportation Commissioner Robert C. Vaughn, who chairs Texas Clear Lanes. “As more people travel our roads, delays are continuing to decline. Texans are spending less time in traffic and more time where they want to be with their families, friends and communities.”
What the Report Covers, and What It Does Not
The rankings and delay figures in the announcement come from the annual congested-segments report. Luke Albert, a research engineer at the Texas A&M Transportation Institute, said movement of people and goods in Texas is at its highest level ever, but that Texans are experiencing less congestion than they were seven to 10 years ago. He called that “a direct reflection of the commitment to funding and delivering projects and other congestion relief measures, especially the Texas Clear Lanes program and other mobility-improving initiatives throughout the state.”
TTI posts a statewide listing of road segments with year-to-year comparisons. That page describes the underlying measures as covering the top 100 road segments and, more broadly, data for more than 2,100 road segments over more than 11,000 miles across Texas. The interactive tables on that site were not readable as text for this article, so no additional ranks, hours of delay, or dollar figures are taken from the dashboard.
The TxDOT release also refers to a regional comparison table of traffic demand, delays, and commuter savings from 2017 to 2025. That table appears on the page as an image, and those regional totals are not transcribed here.
The 11 percent decline in statewide delay is a comparison with 2017, not a claim that congestion has disappeared, or that every metro area improved by the same amount. All of the current Top 100 segments are still in the four largest urban areas, and several of the projects TxDOT cited, including the Oak Hill work, are described as only partially complete. The dollar savings are the department’s estimates of delay and fuel costs. November’s report is the agency’s account of how those investments are showing up in the 2025 data.